

Reading a run
Umpteenth records each run of a job in full: its status and cost, each model turn, and each command the agent typed along with the output. Open the Runs list to find a run and its page to read it, and check the Dashboard for totals across all jobs.
Finding a run
Section titled “Finding a run”Runs in the sidebar lists every run of every job, newest first. A job’s own Runs tab shows the same table for that job alone, and the command palette (⌘K or Ctrl+K) searches jobs and runs from any page.
Each row shows the run’s Status, Job, # (its number within the job), Mode, an icon for the trigger, Started, Duration, Tokens, Cost and Model. For a finished run, the bar under Duration splits its time into phases. Hover it to see the time spent in each: Queue, Sandbox, LLM, Tools and Other.
Four filters above the table narrow the list:
- Status and Mode take the values described on this page and on How jobs learn.
- Trigger is one of Manual, Schedule, Webhook, API and Retry.
- Date offers Last 24 hours, Last 7 days, Last 30 days, or a range you pick in the calendar.
Search runs matches job names and the text of run summaries and errors, so a search for rate limit finds the runs whose error mentions one.
Filters, search and sort live in the URL, so you can bookmark a filtered view or paste it into a chat.
The list updates while you look at it. On the first page with the default sort, new runs appear at the top. Anywhere else, a button such as 2 new runs shows up instead, and the rows under your cursor stay where they are.
Run statuses
Section titled “Run statuses”A run passes through up to four live statuses and ends in one of five final ones. You can cancel it in any live status.
| Status | Meaning |
|---|---|
| Queued | The run waits for a slot. Each replica executes at most runs.max_concurrent runs at once (3 by default), and a job set to Queue holds new runs until its active run ends. |
| Provisioning | Umpteenth resolves the model, checks the daily spend limit, waits for the job’s image, creates the sandbox and runs the setup script. |
| Running | The agent works, or a graduated job’s main script runs. |
| Verifying | Scripted runs only. Umpteenth checks what the main script did, and if a check fails, the run goes back to Running while the agent takes over. |
| Succeeded | The agent finished with success, or the main script passed its checks. |
| Failed | The agent finished with a failure, the run hit its turn or cost limit, a step before the work failed (no model, the daily spend limit, the image build, the setup script), or the process running it died, which leaves an error starting with interrupted:. |
| Timed out | The run hit its time limit. Time spent waiting for the job’s image counts toward it. |
| Cancelled | You clicked Cancel, or Umpteenth shut down while the run was in flight. |
| Skipped | A trigger arrived while another run of the job was active, and the job’s When runs overlap setting is Skip. Umpteenth records the run so the history shows the trigger. |
Managing jobs covers the limits and their defaults, and Triggers and schedules the overlap setting. For runs caught by a restart, see Upgrades and maintenance.
The run page
Section titled “The run page”Click a run to open its page.
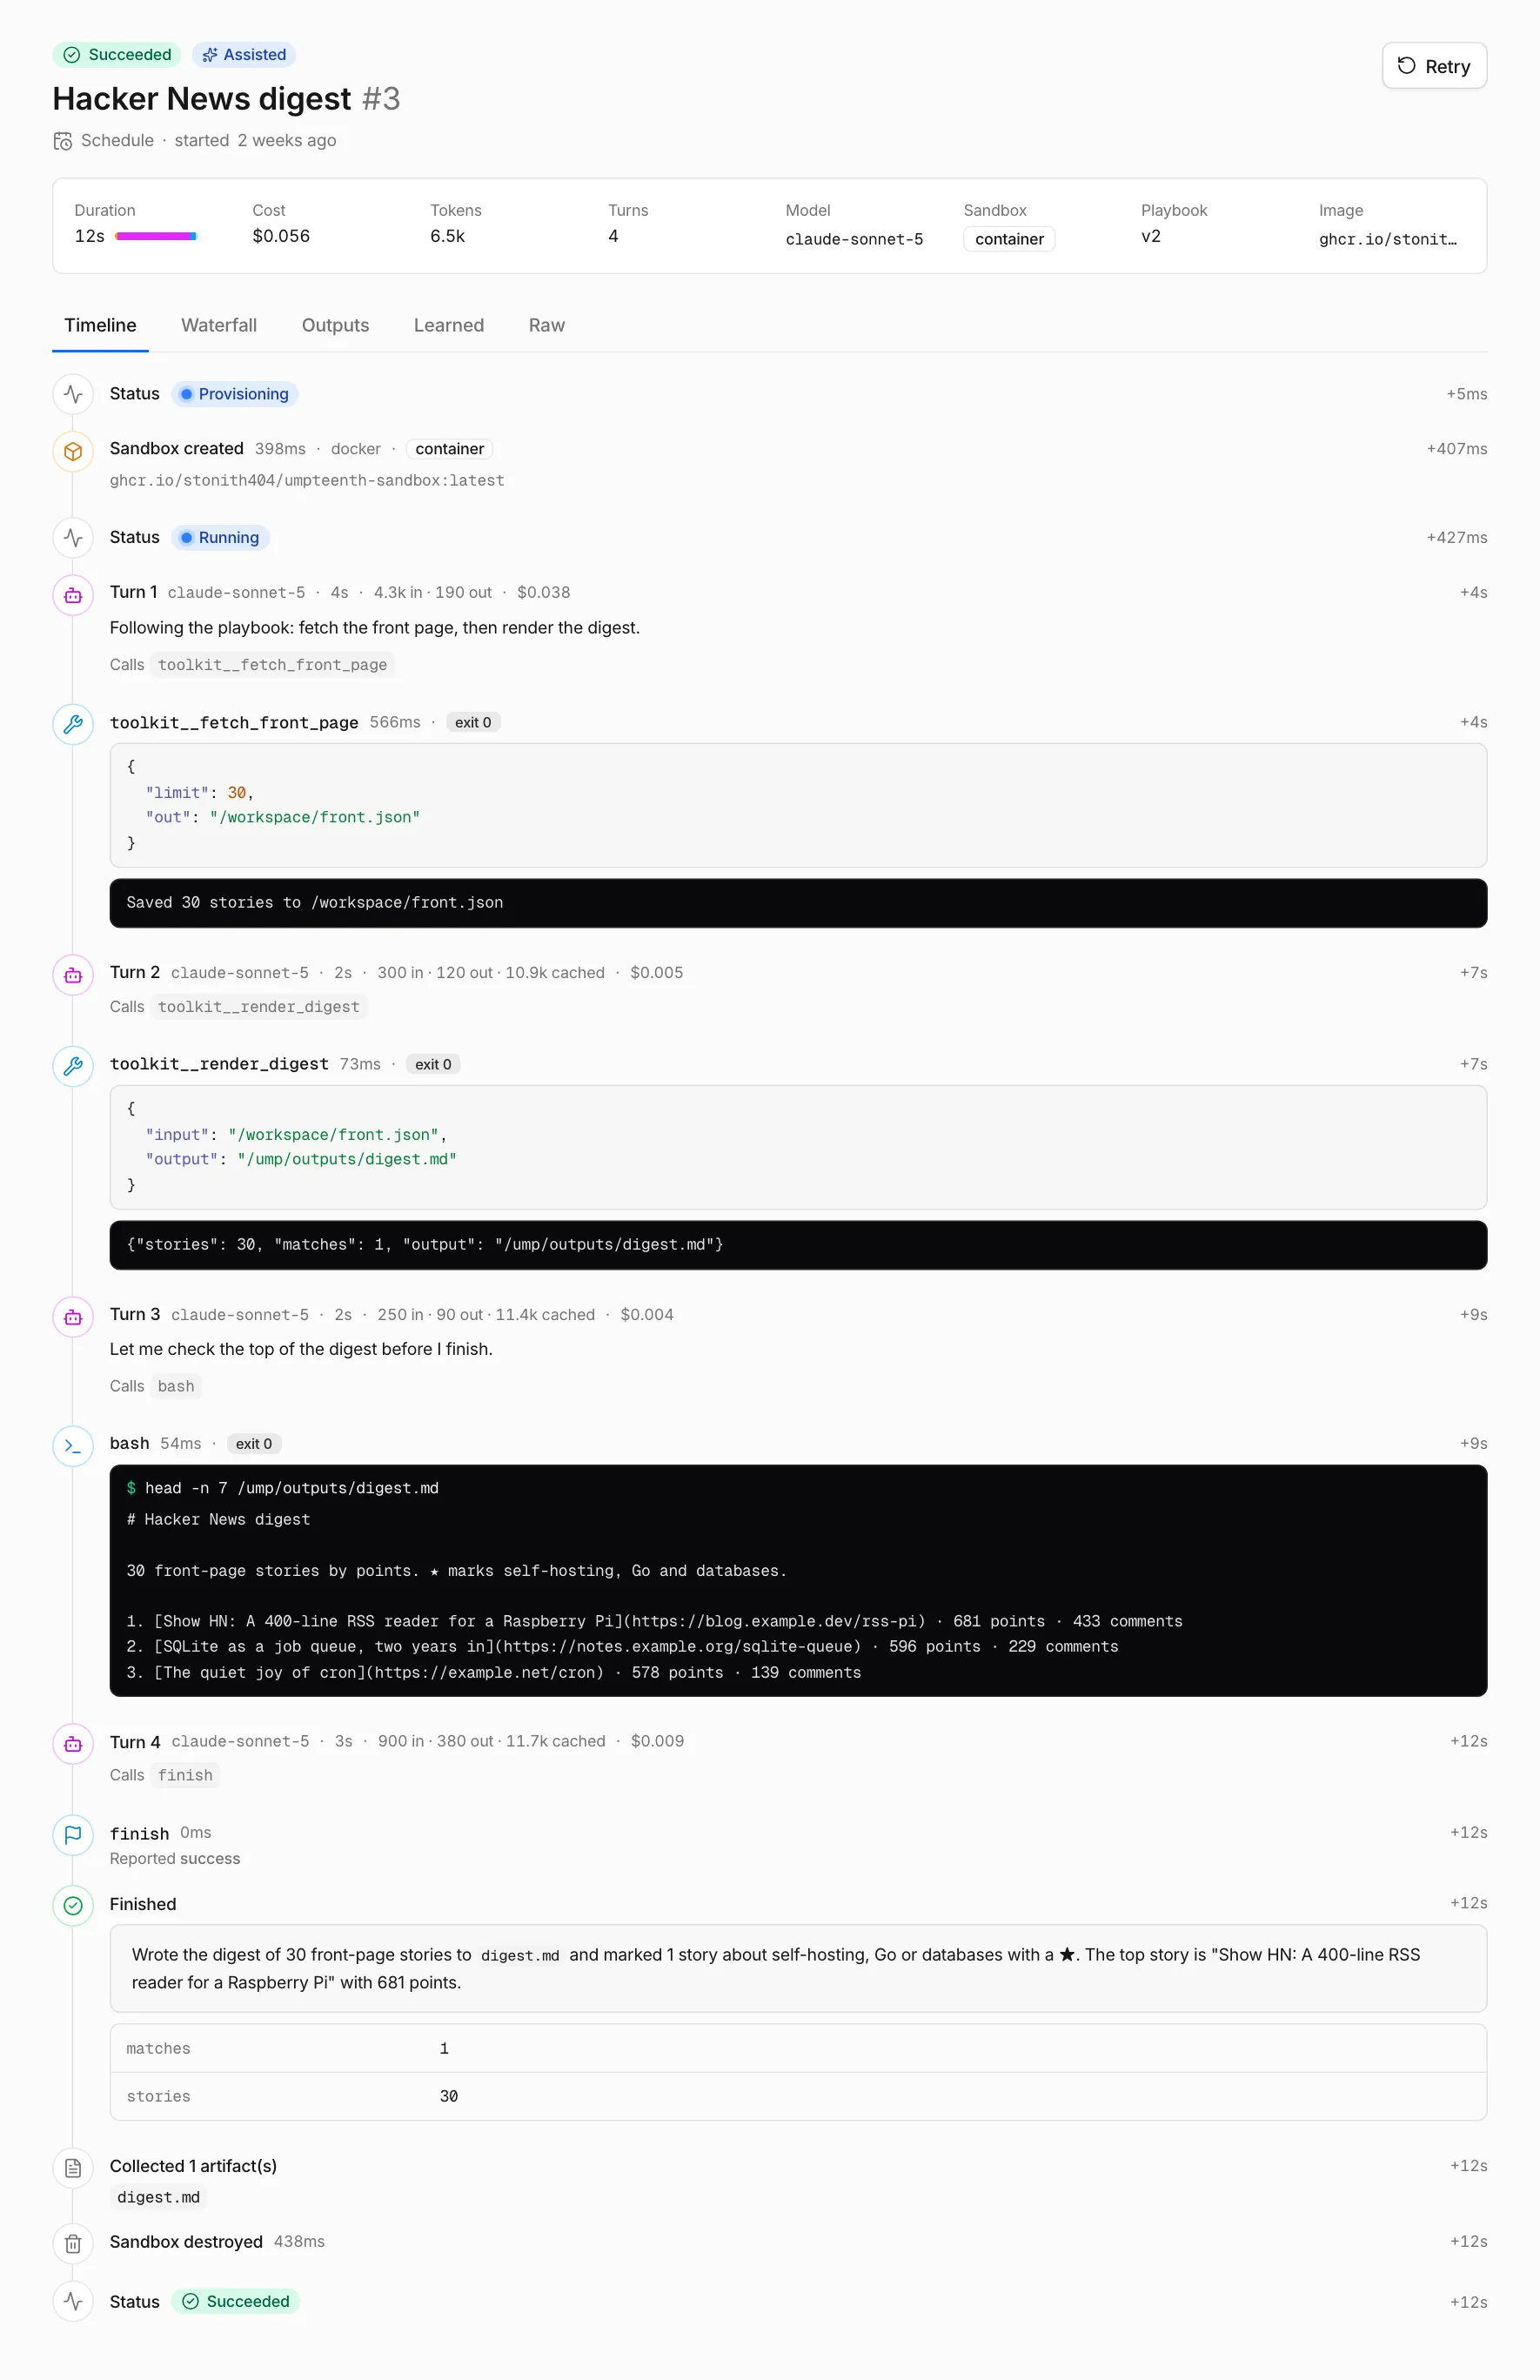
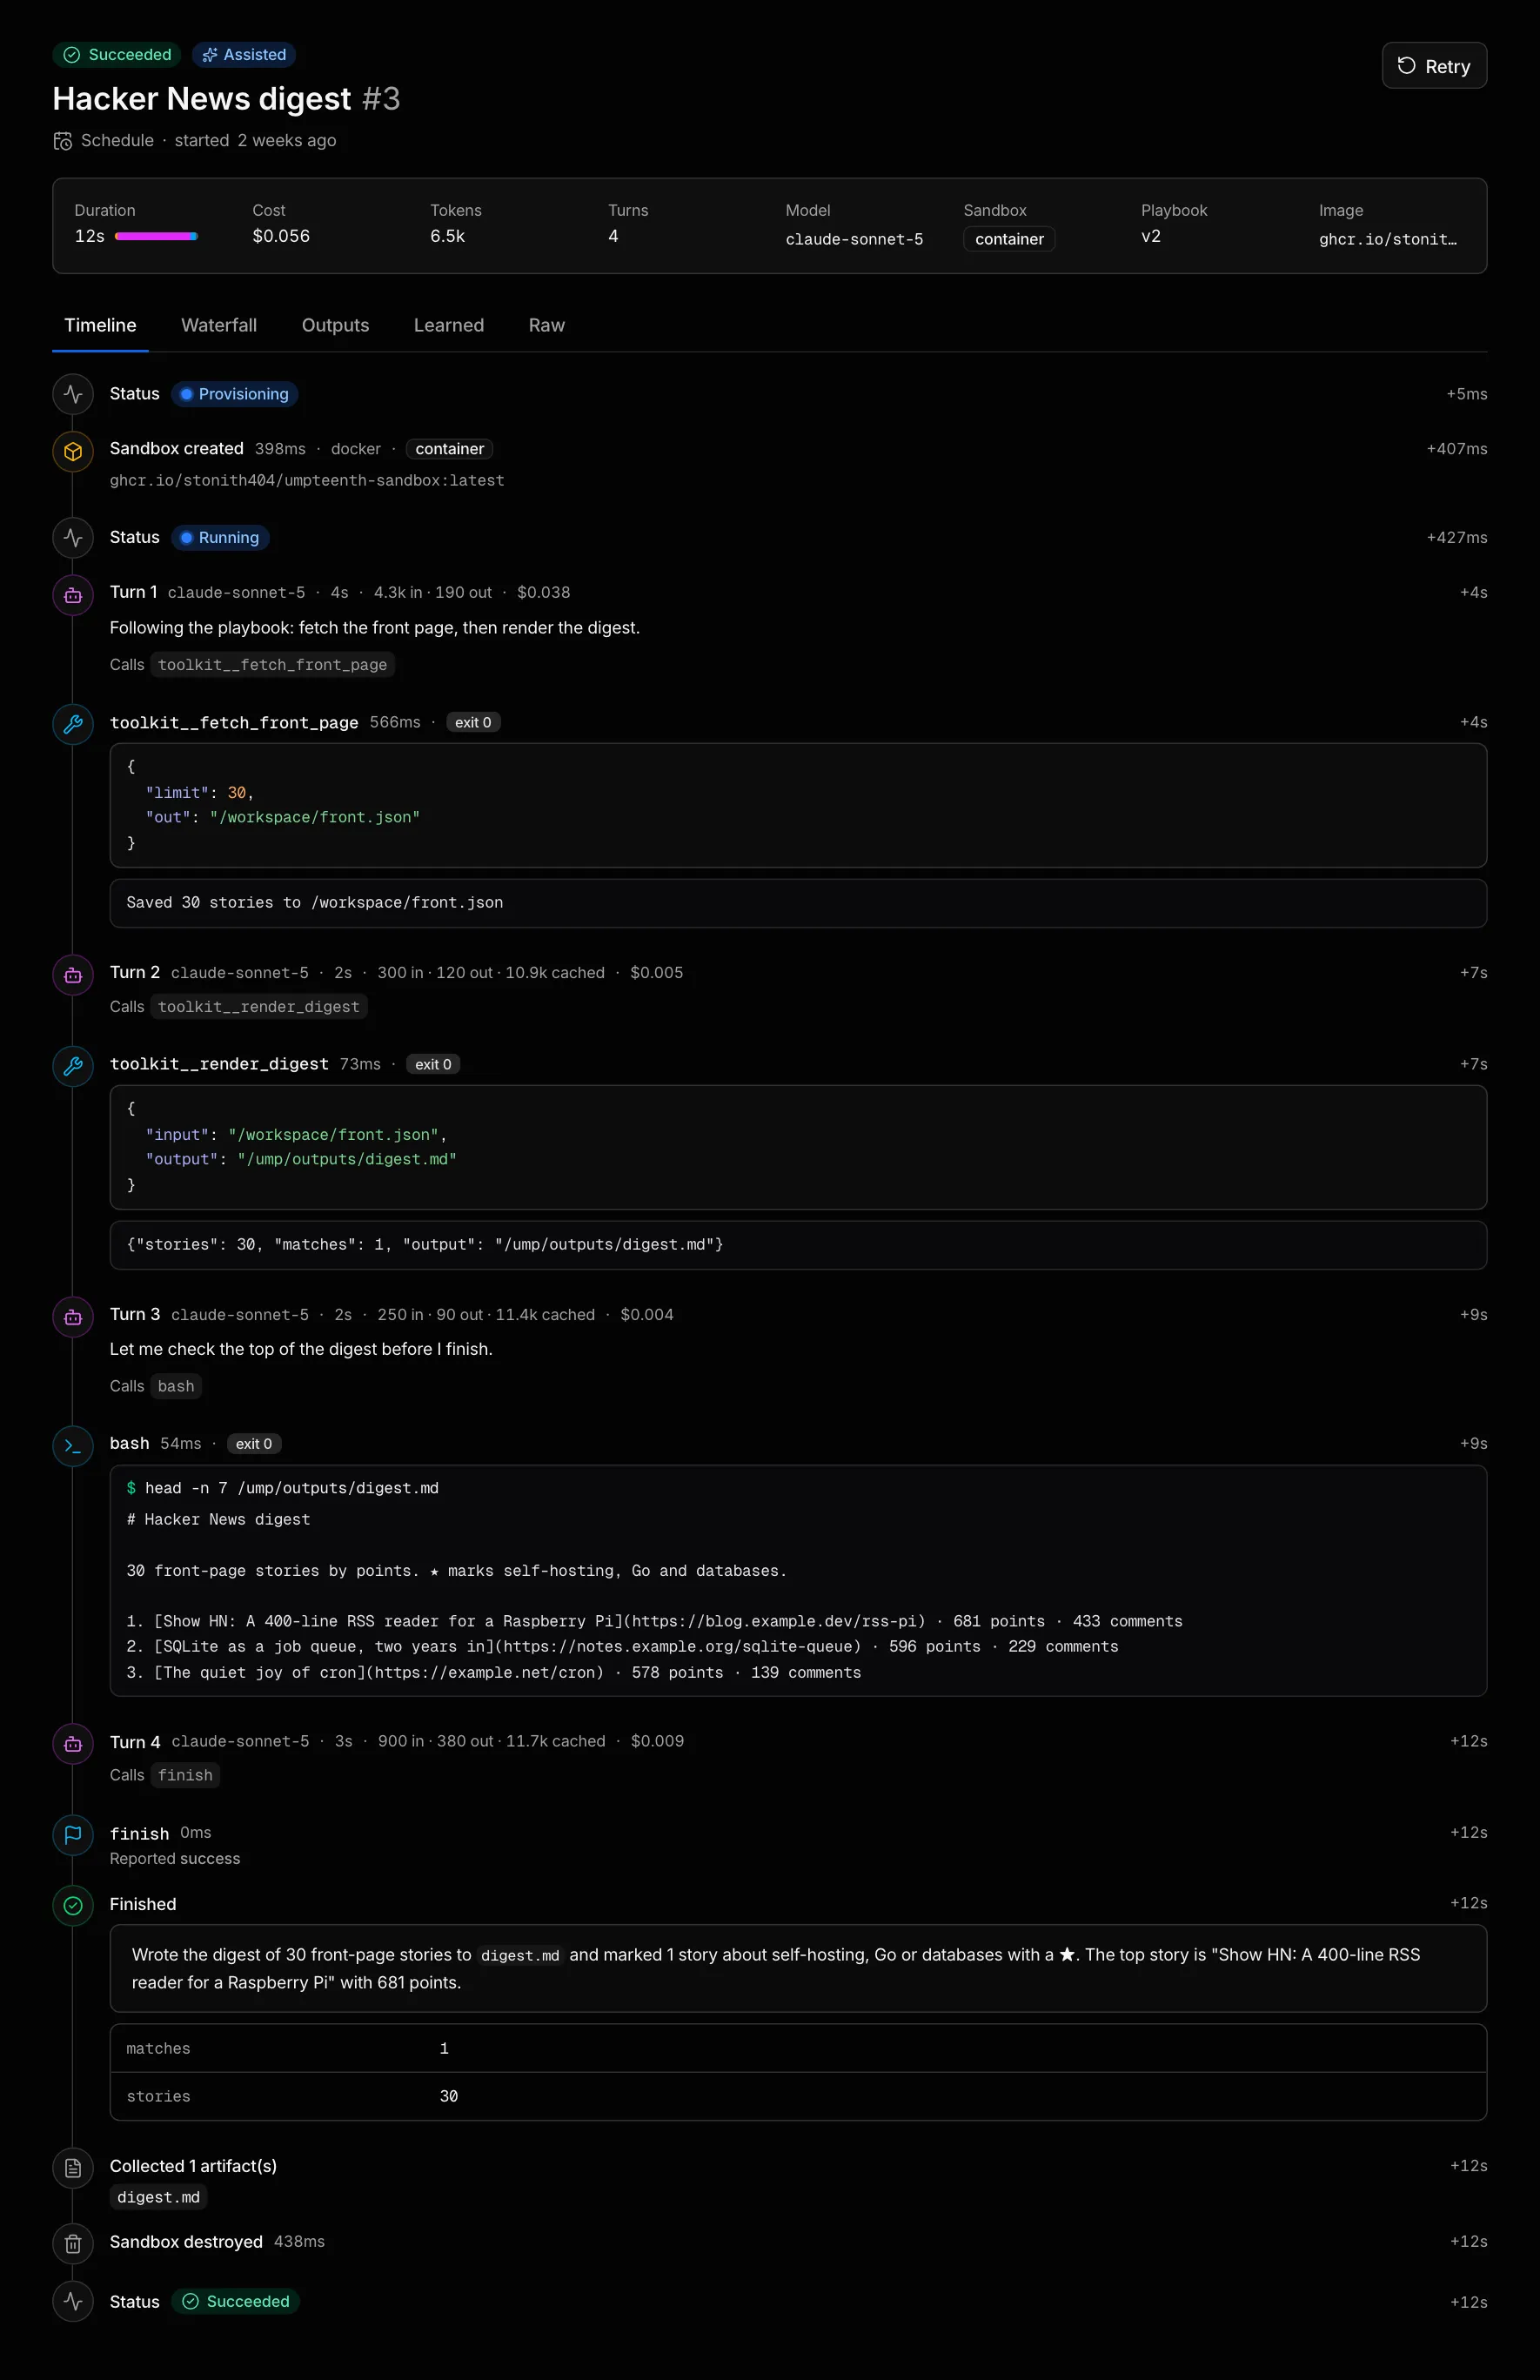
The header carries the status and mode badges, the job name and run number, the trigger and who started it (“Manual by you”), and the start time. A scripted run that needed the agent’s help shows the mode Scripted · fell back.
Below the title, a row of stats sums up the run:
- Duration, with the same phase breakdown on hover
- Cost and Tokens, where hovering the tokens splits them into input, output and cache
- Turns, the number of model calls the agent made
- Model, the model the run used
- Sandbox, the isolation the sandbox had:
container,gvisorunder gVisor, ormicrovmunder a Kata Containers runtime - Playbook and Image, the playbook version and the image the run started with
On a live run, cost, tokens and turns count up as events stream in. For a failed, timed-out or skipped run, a red box titled The run did not succeed holds the error.
Five tabs sit below the stats: Timeline, Waterfall, Outputs, Learned and Raw. The URL keeps the open tab, so you can send someone a link to a run’s outputs or its waterfall.
Timeline
Section titled “Timeline”The Timeline streams the run as it happens, one step per event.
Each step shows its offset from the start, such as +1m 12s, and the clock time when you hover the offset.
- Turn 3 is one model call, with the model, duration, tokens and cost. Reasoning holds the model’s thinking when the provider returns it, and an amber
stopped:note marks an unusual stop reason. - Shell commands appear as a terminal with the command, its output and an exit N badge.
Red
timed outandout of memorylabels mark commands that ran out of time or memory. - File tools show the path they read or wrote.
- Sandbox created, Setup script and Sandbox destroyed bracket the work.
- MCP · github marks the connection to an MCP server and how many tools it offered.
- Steps titled
umpare calls from inside the sandbox through the ump CLI, such as an MCP tool or aump llmprompt, with their cost. Step fetch_prs is progress a script reported withump step fetch_prs. - Verification passed or Verification failed lists each check of a scripted run, and Fell back to the agent gives the reason the agent took over.
- Conversation compacted means the conversation neared the model’s context window, so the model summarized the earlier messages and the run continued from that summary. Models and costs covers when that happens.
- Finished or Finished with a failure holds the agent’s summary and outputs, and Error names what stopped the run.
On a live run the page follows the newest step. Scroll up and it stays where you left it while new output arrives, until you click Follow output to jump back to the end and follow again.
The agent’s dead ends stay in the timeline next to what worked, which makes it more candid than most incident write-ups. To debug a failed run, start at the bottom: find the last command with a non-zero exit, then read the turn before Finished with a failure.
Waterfall
Section titled “Waterfall”Open the Waterfall tab when a run took four minutes and you want to know where they went.
It draws every step that took time on one axis, grouped into Run (the queue and provisioning), Sandbox, LLM, Tools, ump CLI and MCP.
A long Provisioning bar points at an image build, and a long setup bar under Sandbox at a slow setup script.
A column of long LLM bars means a slow model.
Failed spans turn red, and a bar’s tooltip gives its duration and its offset from the start of the run.
Outputs
Section titled “Outputs”The Outputs tab collects what the run produced, in five cards:
- Summary: the Markdown summary the agent wrote when it finished, or the one a main script set with
ump summary. - Outputs: structured values the run reported, such as a count or a URL.
- Artifacts: files the run wrote to
/ump/outputs, each with a download link. Umpteenth collects them from failed runs too, up to 50 MiB per run. - Input: the JSON the run could read from
/ump/input.json, such as a webhook body. - Run instructions: the extra instructions someone gave this run through Run now or the API.
Learned
Section titled “Learned”Learned shows what reflection took from the run: each change it proposed, whether Umpteenth applied it, held it for your review or rejected it, and the resulting playbook diff. If reflection skipped a run that succeeded, failed or timed out, the tab offers Learn from this run. See How jobs learn for a walkthrough of the tab.
Raw holds the run and its events as the API returns them, with Copy and Download JSON. Attach the file to a bug report.
Cancel, retry and learn
Section titled “Cancel, retry and learn”Cancel sits at the top right of the run page while a run is live. Confirm with Stop run, and Umpteenth destroys the sandbox and ends the run as Cancelled. A queued run never starts: it ends at once with “Cancelled before it started”.
Retry takes its place on finished runs and starts a new run of the same job with the same input and run instructions. The new run uses the job’s current playbook and settings, and its trigger reads Retry. It follows the job’s When runs overlap setting, so under Skip with another run active you get a skipped run and the warning “The retry was skipped because the job is already running”. Pausing a job doesn’t block retries, because the Enabled switch stops only schedule and webhook runs.
Learn from this run appears next to Retry when reflection skipped a run that succeeded, failed or timed out. It starts reflection on that run whether the job’s Self-improve switch is on or off.
The REST API offers the same three actions.
Retention
Section titled “Retention”Umpteenth deletes the timeline events and artifacts of runs that finished more than Retention days ago.
You set the number under Settings → General → Spend and retention.
Until someone saves that card, your workspace uses runs.retention_days, 90 days by default.
The run record stays, with its status, summary, outputs and cost, so the list and the Dashboard keep their history.
A pruned run’s Timeline reads “No events”.
The Dashboard
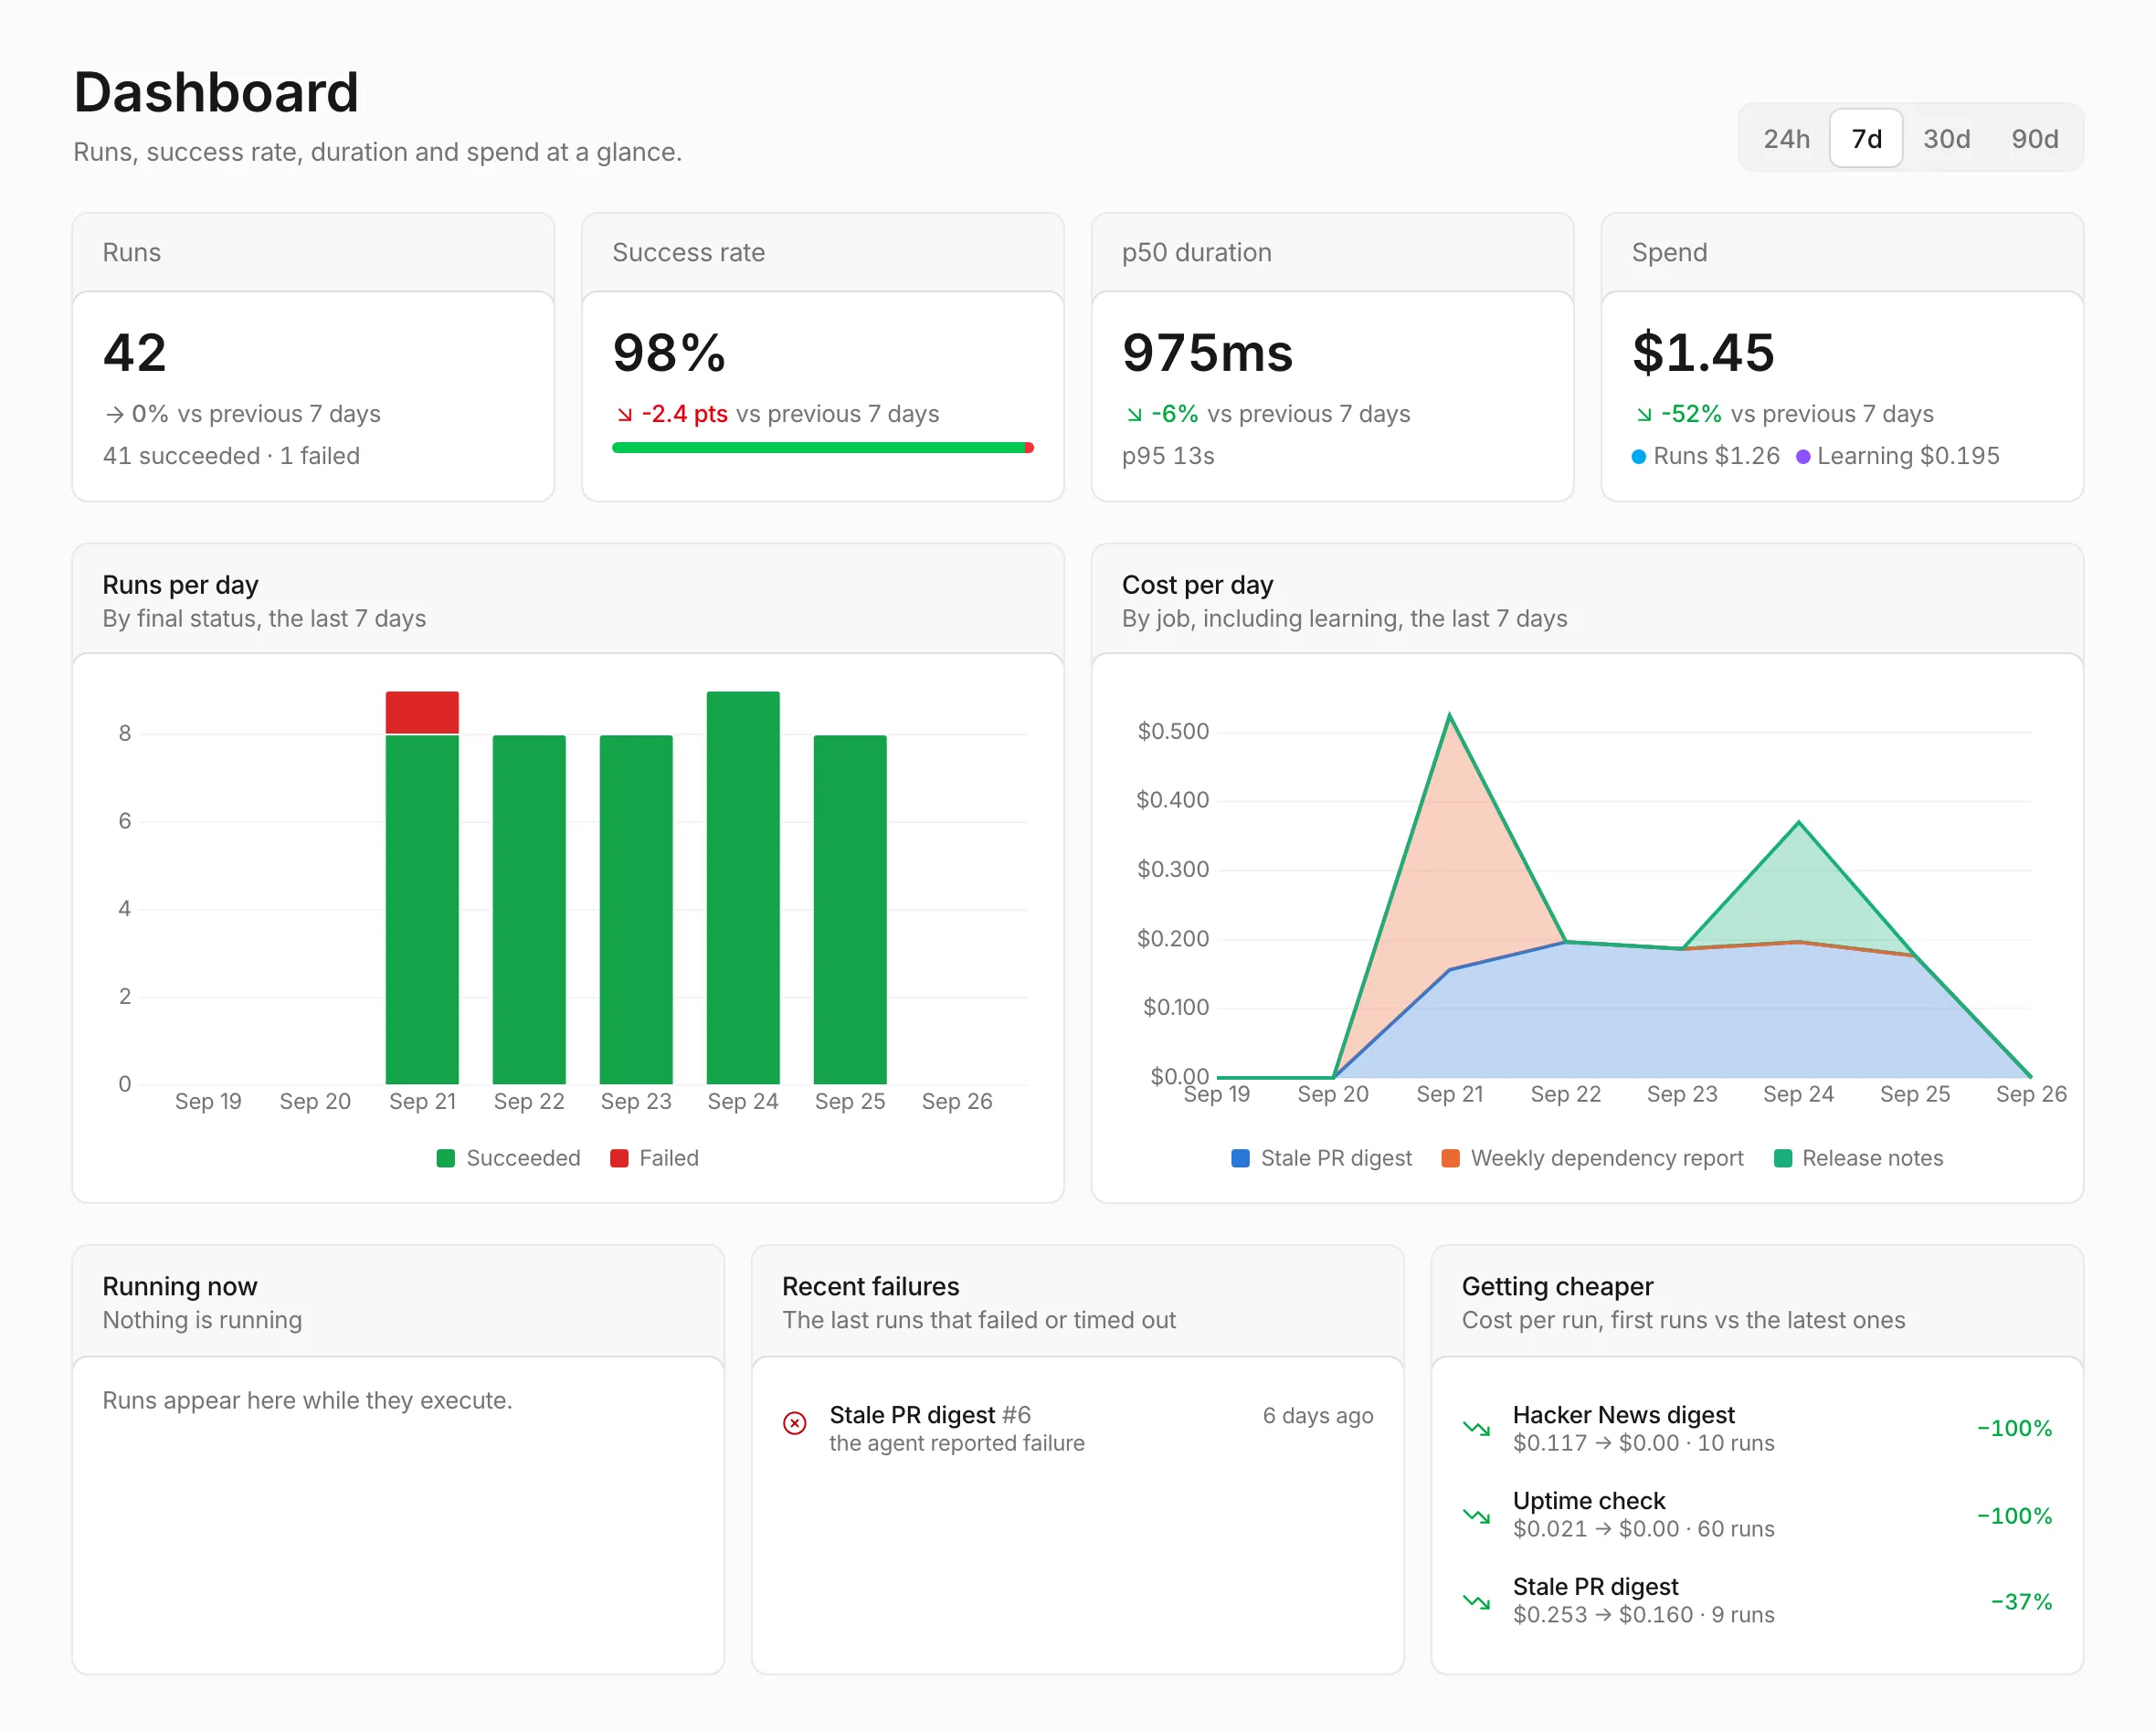
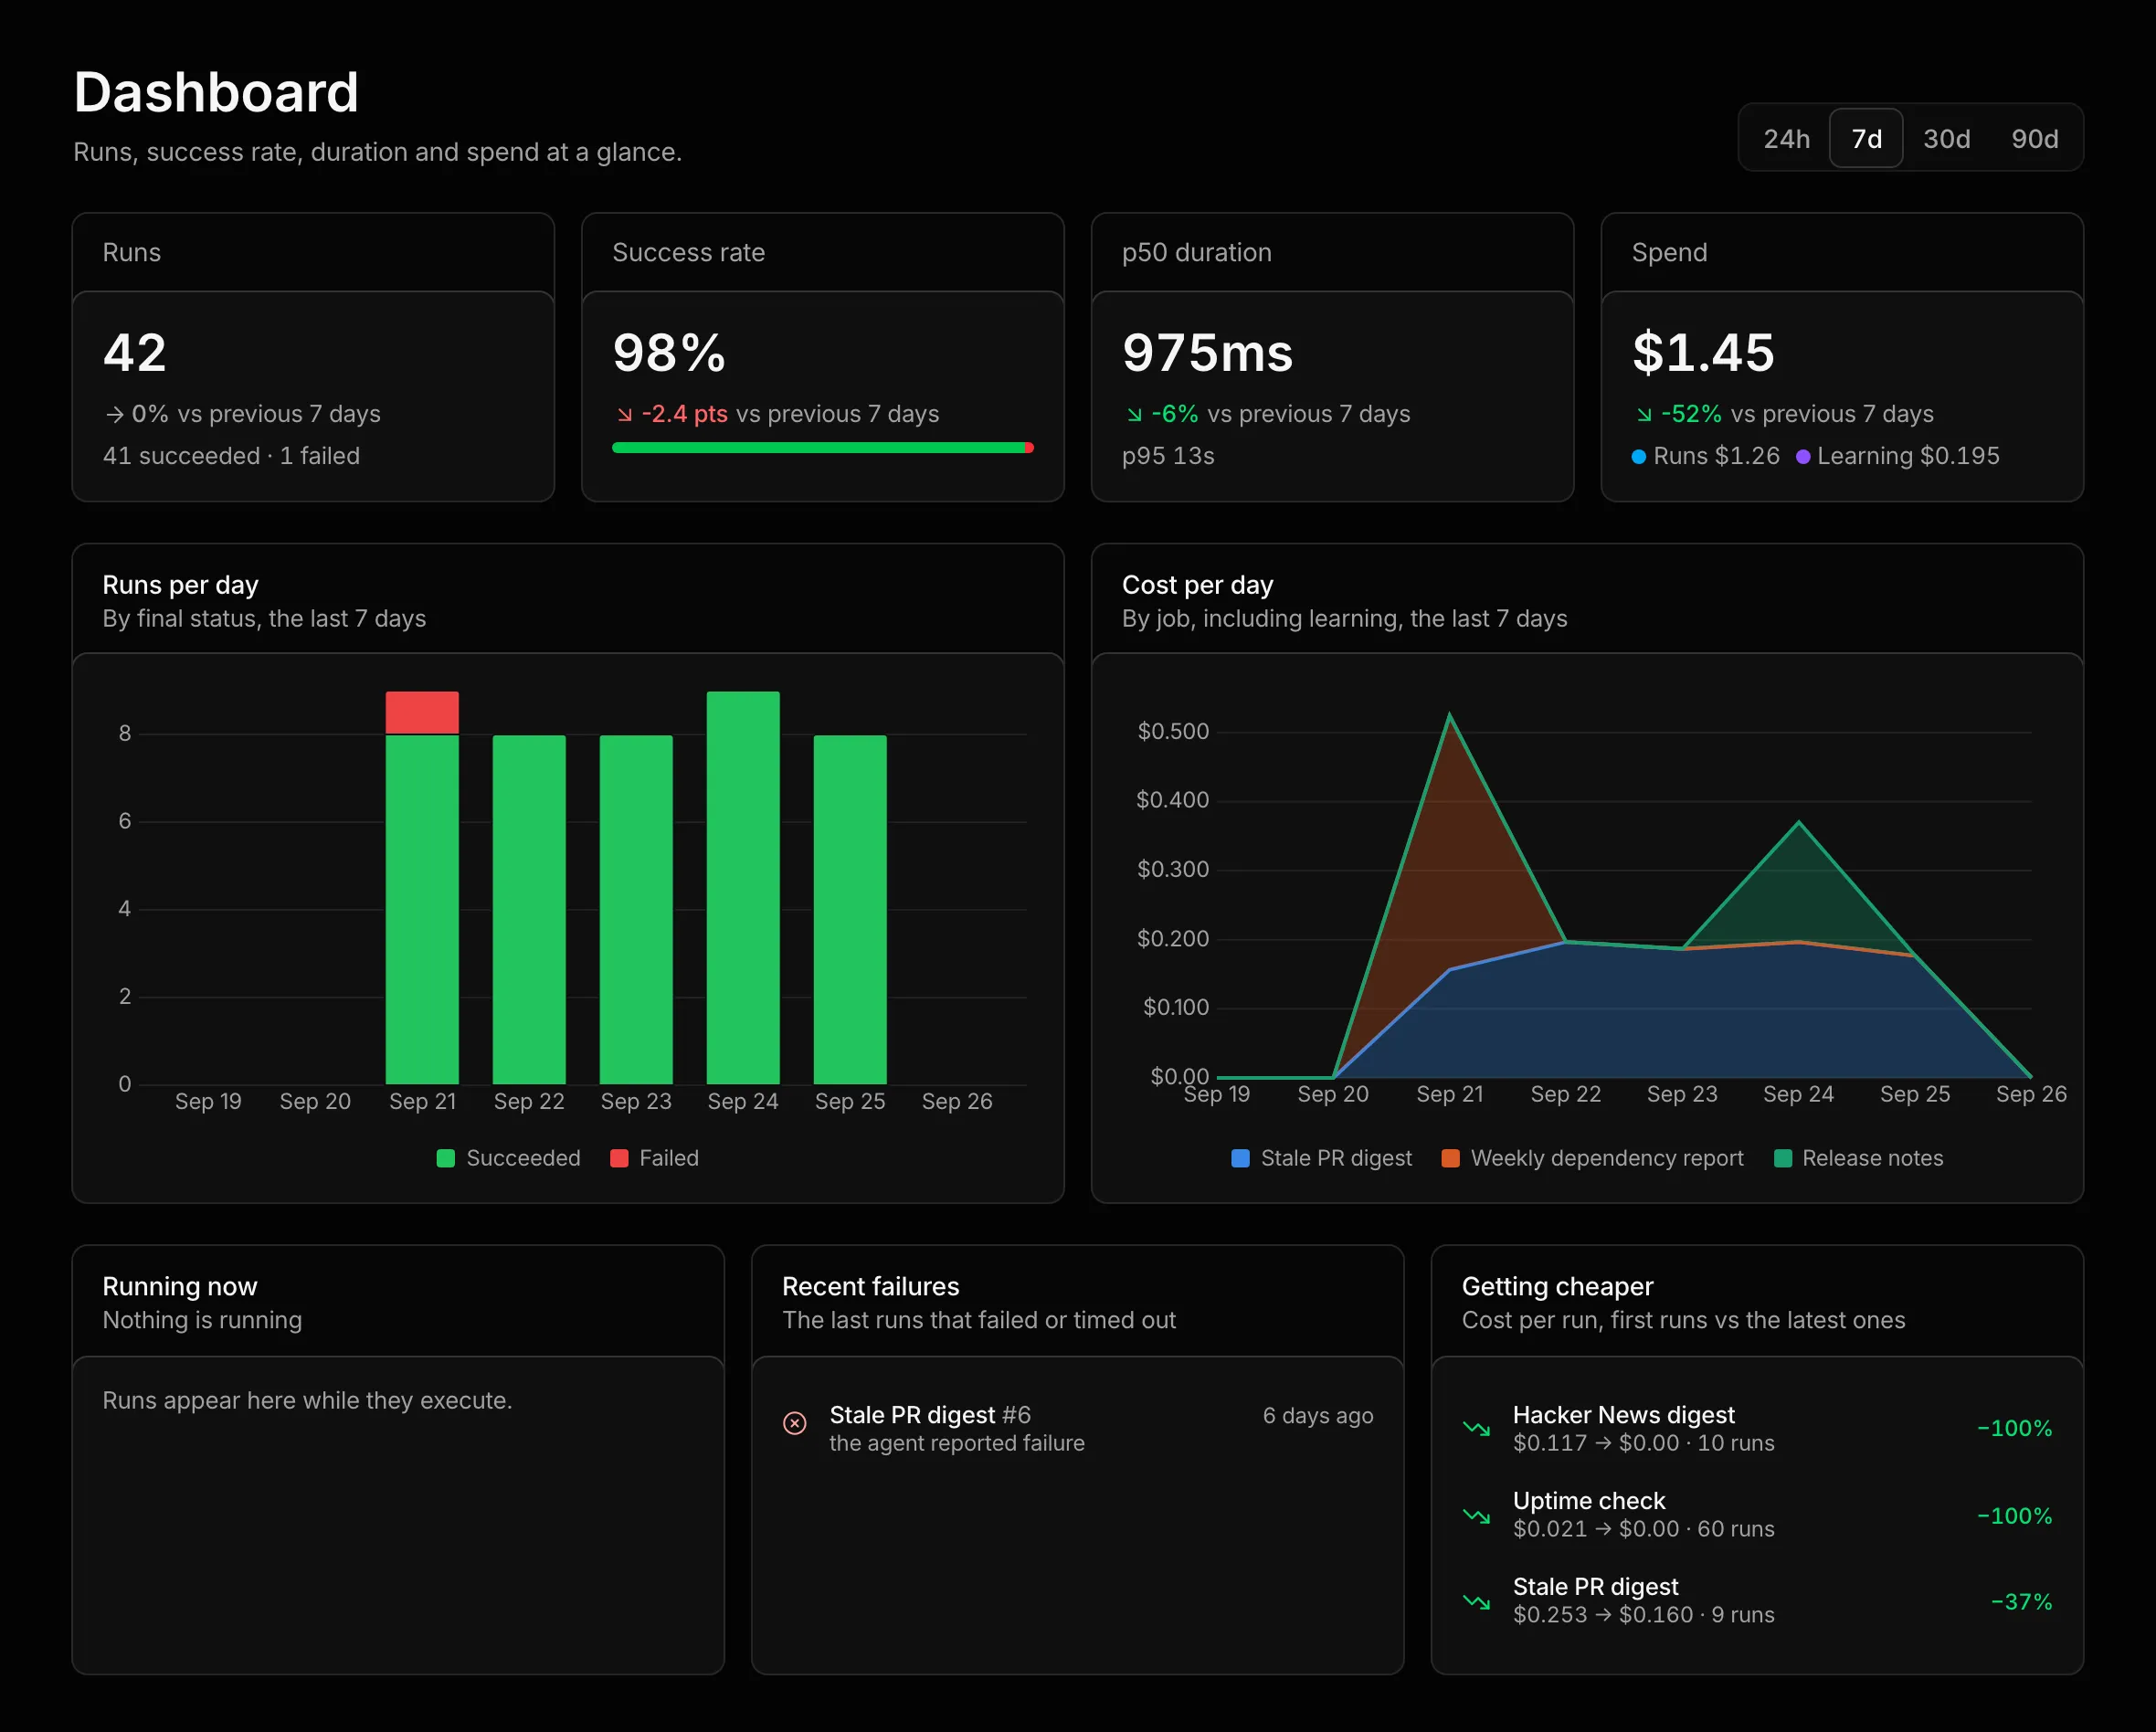
Section titled “The Dashboard”The Dashboard, the first item in the sidebar, sums up runs and spend over 24h, 7d (the default), 30d or 90d. Each card compares its number with the previous period of the same length.
| Card | Counts |
|---|---|
| Runs | Runs queued in the period, skipped runs excluded. The footer splits them into succeeded and failed, and failed includes timed out. |
| Success rate | Succeeded runs divided by succeeded, failed and timed-out runs. Cancelled runs count neither way. |
| p50 duration | The median run duration, with the 95th percentile below it. |
| Spend | Run cost plus learning cost, split into Runs and Learning. Learning is reflection plus the verifier of scripted runs. |
Runs per day stacks runs by final status. Cost per day stacks cost by job with learning included, names the five most expensive jobs and folds the rest into Other. Days in both charts are UTC days.
Below the charts, Running now lists live runs, queued ones included, with how long each has been going. Recent failures holds the last five runs that failed or timed out, from any period, with their errors.
Getting cheaper lists up to five jobs with the largest percentage drop in run cost, and gives both averages for each. A job qualifies once it has at least six succeeded runs in the last 90 days and its latest three succeeded runs cost less on average than its first three. The comparison counts run cost alone and leaves reflection out, so a job that graduated to a script tends to show up here.